San Juan County Tax Analysis
Report prepared by Amanda Azous, Azous Environmental Sciences, Olga, WA, December 1995
Conclusion:
This analysis shows that from the perspective of an individual property owner, the fewer the parcels that end up developed, the lower their future tax burden, due to the higher cost of supporting services to developed land. It is very important that we, the citizens of San Juan County understand the financial costs as well as benefits of land development.
Overview:
Taxes are levied as a means to fund county operations, road construction and maintenance, schools, capitol improvements and special projects approved by voters. It is important for county citizens to understand how taxes are assessed to make educated decisions in prioritizing for the future. The following analysis looks at the recent history and distribution of taxes levied and analyzes the proportion of tax increases attributable to population increases. It goes on to predict an estimate of the future tax obligation for property owners under the build-out population predicted by the current county zoning plan.
Methods:
This analysis relies heavily on data published in Population Issues and Land Use Inventory, Appendix 1 of the Comprehensive Plan as well as information published in the annual statements by the San Juan County Assessor’s Office. The assumptions of this analysis are conservative. There are additional methods to evaluate this data but more detailed tax and budget information was not available to the author.
This analysis is based on the following assumptions:
1. Property tax assessments are a reflection of the costs of operating and governing the county.
2. Certain of those costs can be attributable to the governing and servicing of land whether populated or not, but other taxes levied result from costs associated with governing and providing services that are needed for people.
3. No inflation factor was applied in any of these analyses.
3. Little detailed tax information prior to 1987 was available to the author.
Qualifier: The author is not an expert on these matters. No doubt better methods are available to assess the tax implications of increased population growth. However, this discussion does provide insight into some of the dynamics occurring and should provide direction for more professional studies.
Results:
Figure 1 shows the growth of property taxes since 1972. It also shows the growth and addition of taxes by categories. State schools, county current and local schools, in that order, account for the majority of increases that have occurred. All the tax categories except for fire, hospital, cemetery districts, parks and recreation and the Town of Friday Harbor have increased with the growth of San Juan County’s population.
Figure 1. Property Tax Growth Since 1972.
Figure 2 shows total taxes levied has increased in relation to population growth from 1972 to 1994. The correlation is highly significant (R2 = .932 and p<.05).
Figure 2. Total Property Taxes Levied From 1972 to 1994 in Relationship to Population Growth.
The following table (1) shows the distribution of taxes levied attributed to serve fair market value (FMV) lands (parcels with, or the potential for, human habitation) versus tax categories levied to support lands classified as designated forest land, agricultural, or open space (AG/OS/For).
Figure 3 shows the same data as Figure 2, but averages total taxes levied over the number of taxable parcels from 1987 to 1994. Table 1 was used to determine an estimate of the taxes levied needed to serve fair market value lands versus AG/OS/For parcels. This data was averaged over the number of parcels and is also shown in Figure 3.
The data shows that the tax cost of FMV lands has historically been much higher than the tax cost of services to support agricultural, open space and designated forest land. The difference between the two could be viewed as the historical cost of serving populated land versus unpopulated land. People often make the argument that the county should encourage land development in order to increase the tax base. Figure 3 suggests that this is a false view. This analysis shows it costs the owner of a taxable parcel more in taxes to support services to FMV lands than it does to service AG/OS/For lands so the net effect is higher taxes for a land owner when land is developed.
Table 1. Assumed Distribution of Tax Costs
|
Tax Category |
Fair Market Value Parcel (FMV) |
Designated Forest Land Agriculture & Open Space (AG/OS/For) |
Note |
|
State Schools |
X |
X |
State assessed obligation. |
|
Local Schools |
X |
Local obligation. |
|
|
County Current |
X |
X |
County governance and operations. |
|
Conservation Futures |
X |
||
|
County Roads & Diverted Roads |
X |
X |
* |
|
Fire Districts |
X |
X |
* |
|
EMS Districts |
X |
||
|
Port Districts |
X |
X |
* |
|
Cemetery Districts |
X |
X |
* |
|
Library Districts |
X |
||
|
Town of Friday Harbor |
X |
||
|
Hospital District |
X |
||
|
Park & Recreation |
X |
Service costs were attributed in proportion to the distribution of parcels among categories and not to actual costs to service development on the land. Though FMV parcels would, in most cases, require a higher service level and greater associated cost than AG/OS/For lands, detailed enough cost data was not available to make that determination.
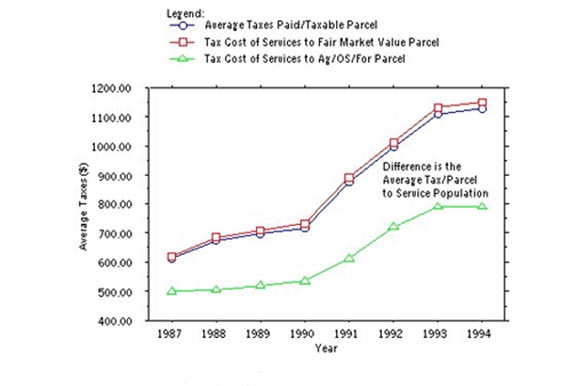
Figure 3. History of Average Taxes Paid.
Population growth was compared to the increases in total taxes levied and the average yearly taxes on a taxable parcel. The historical trend between taxes and population growth was used to develop a regression equation that could predict tax growth based on future population growth. A simple linear regression model was used with very high statistical significance in both cases (R2 = 0.932, 0.958). Figure 4 shows the actual values for total property taxes levied and the predicted values based on the historical trend.
Figure 4. Actual versus predicted values for total property taxes levied.
The regression equation was used to predict total taxes levied into the future based on population growth. Figure 5 shows the predicted growth of taxes in relation to future population growth. The chart is independent of the rate of growth. The San Juan County Comprehensive Plan predicts buildout at somewhere around 43,000 people, but any buildout population can be selected to read the chart.
Figure 5. Predicted Total Taxes Levied as Population Reaches Buildout
On the basis of trends since 1987, Figure 6 shows that average taxes paid on a taxable parcel would be expected to increase roughly six times 1994 levels at buildout, predicted to be somewhere around 43,000 people. (No inflation factor is applied).
Figure 6. Predicted Average Taxes Paid on a Taxable Parcel.
Taxing districts are allowed to increase their budgets by up to 106% of the highest of the last three years allowable without a vote of the electors. It could be argued that the ability to automatically increase budgets are producing the increase in taxes each year. It could also be argued that the needs for those increases are ultimately driven by the service needs of the population. This could be evaluated by looking at whether county service levels have increased or decreased over the same time period. Recent headline news articles in both the Island Sounder and the Journal of the San Juans have reported concerns about decreased services and insufficient funds to meet current work demands in county government and local schools, the two taxing categories that contribute most to the local tax burden. While budget cuts may mitigate the financial problems of these two institutions in the short term, existing service levels will also drop, indicating that current taxes are insufficient to retain existing service levels.
The comprehensive plan also allows for concurrency which means that new development is expected to pay for infrastructure needed to maintain acceptable service levels. The methods outlined for calculating the apportioning of costs are unlikely to be practical in many cases. In many situations the costs of new homes will escalate enormously if all costs to maintain service levels are paid for entirely by new residents. Again, though the author is no expert on these matters, it seems unlikely that concurrency will cover all costs and, while it may somewhat reduce the rate of tax increase, taxes will continue to rise as population grows.
It is the hope of the author that others with more expertise will improve on this analysis and continue these discussions. Many of the historical arguments for encouraging land development may no longer hold true. This analysis shows that from the perspective of an individual property owner, the fewer the parcels that end up developed, the lower their future tax burden, due to the higher cost of supporting services to developed land. It is very important that we, the citizens of San Juan County understand the financial costs as well as benefits of land development.
APPENDIX
The following equations were used to calculate the results shown:
Average cost per tax parcel = Total Taxes Levied
Total Taxable Parcels
Taxes per Fair Market Value Parcel = The sum of tax categories noted in the FMV Column in Table 1*
Number of FMV Parcels
*When costs are shared with AG/OS/FOR, they are dispersed proportional to the number of tax parcels
Taxes per AG/OS/FOR Parcel = The sum of tax categories noted in the FMV Column in Table 1*
Number of FMV Parcels
*When tax categories are shared between FMV parcels and AG/OS/FOR parcels, they are dispersed proportional to the number of tax parcels in that category.
Taxes Attributable to Servicing Population = Taxes per Fair Market Value Parcel - Taxes per AG/OS/FOR Parcel.